Risk assessment and information
During the past decades, the frequency and worldwide impacts of natural disasters have increased rapidly. Natural disaster risks are of high policy and citizen concern in Europe. They are expected to rise further as a result of projected demographic development and land use change, with expansion of residential and production activities in hazard-prone areas. Climate change will further exacerbate risk from natural hazards, and it has been demonstrated to have already increased the frequency and severity of certain extreme climate and weather related events, such as droughts, heat waves and heavy precipitation.
Knowing the increasing trends in natural disasters and losses, it is imperative to take action on disaster risks to improve resilience of European societies to natural hazards. The main goal, therefore, of the ENHANCE project is to develop and analyse innovative ways to manage natural hazard risks. Key is to develop new multi-sector partnerships (MSPs) that aim at reducing or redistributing risk, and increase resilience of societies. For several reasons, comprehensive and accurate risk information is important for MSPs and for policy-making in general. First, a better understanding of natural hazard risk is important for preventing excessive socio-economic stress at levels from local to national to international, and in order to plan for reducing risk from extreme events in the future.

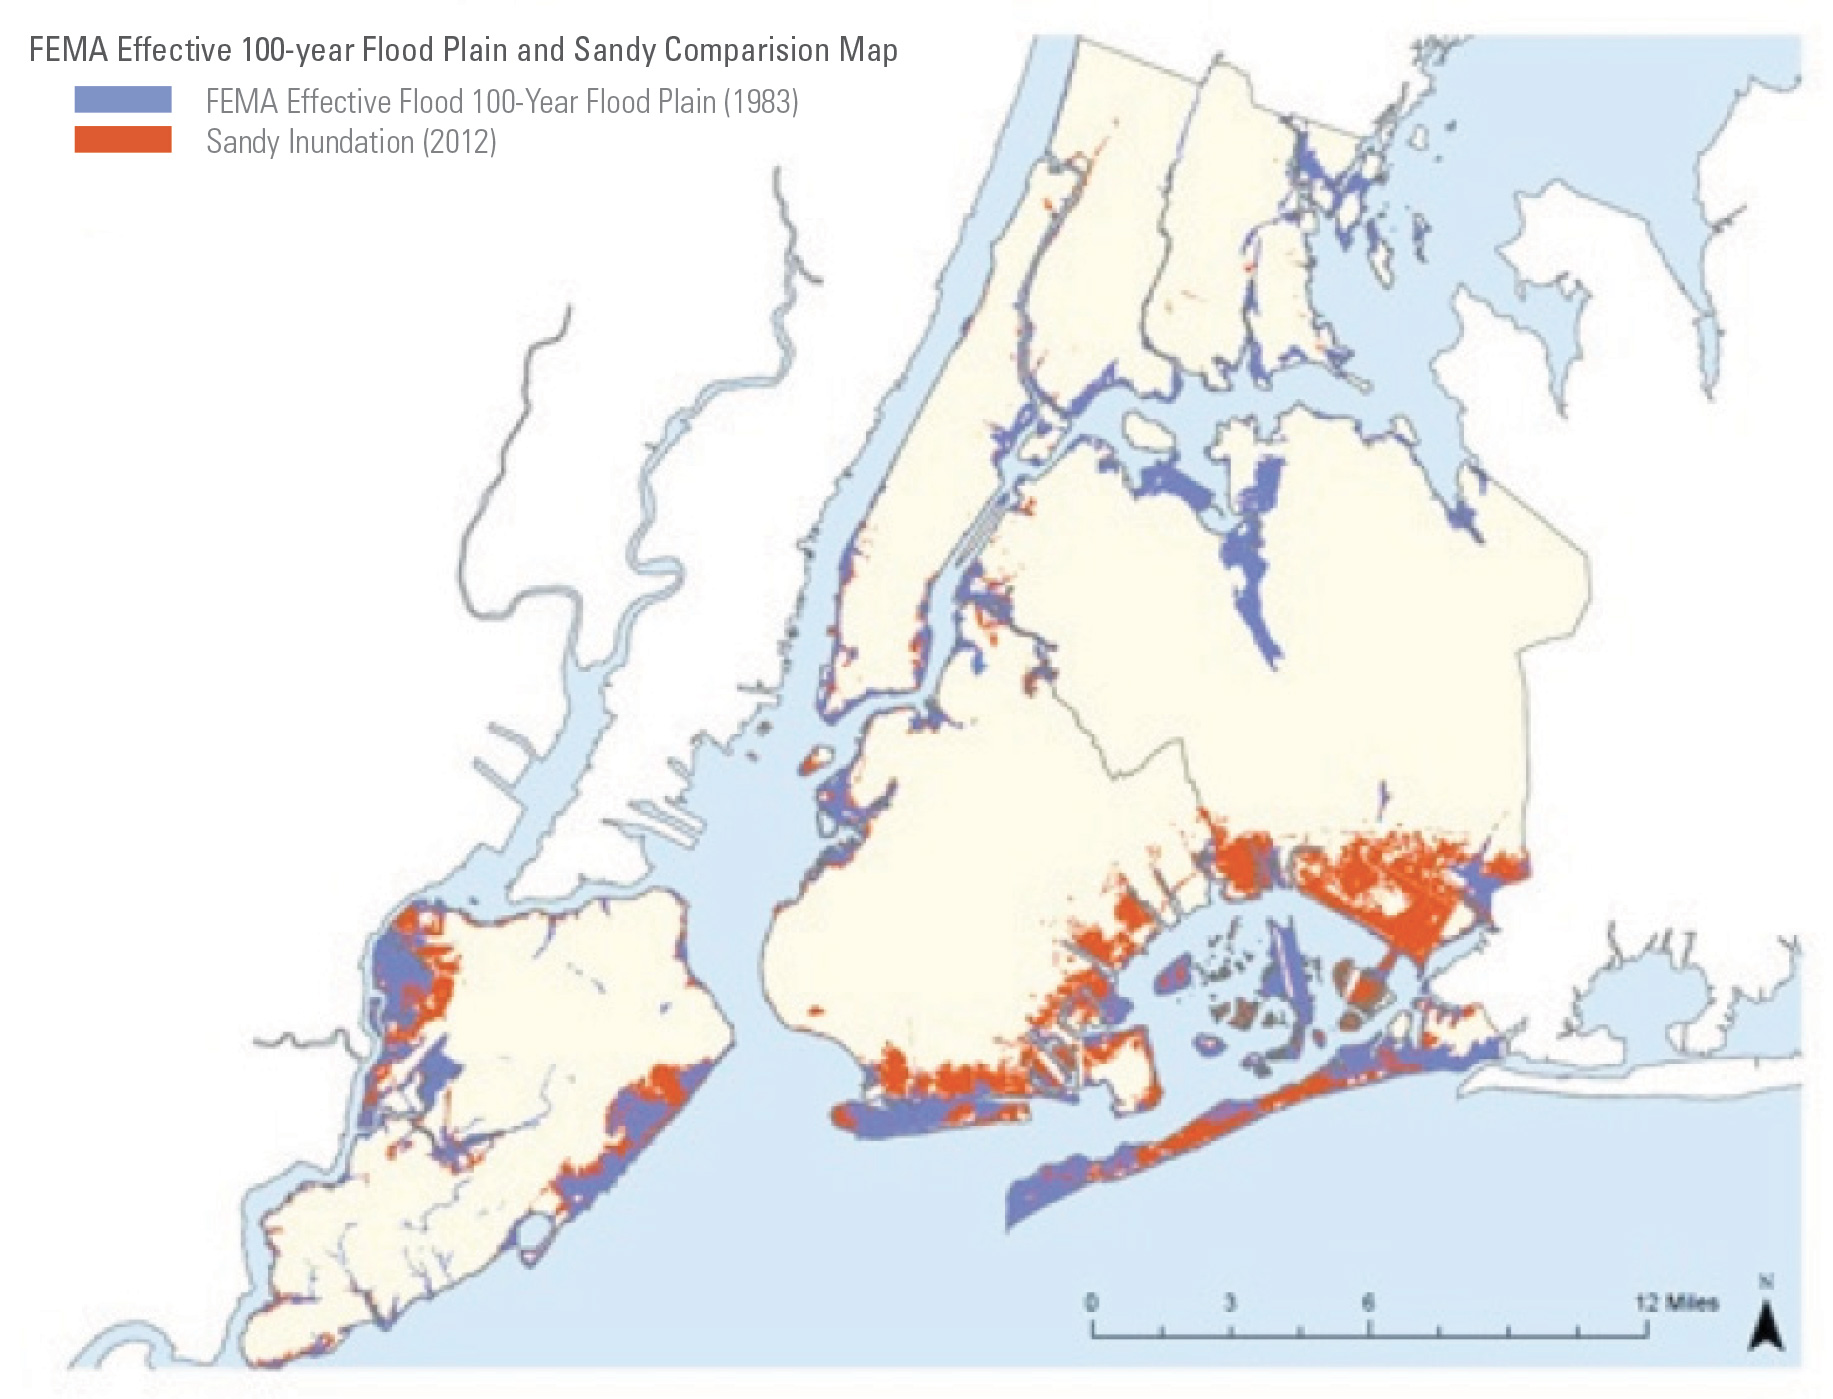
An example of where inaccurate risk information can lead to is exemplified in Figure 2.1. This figure shows a map for NYC, for the actual flooding due to hurricane Sandy in 2012 (red colour) and the official 1/100 flood zone (blue colours) provided by the Government before the hurricane occurred. The figure shows that many of the actual flooded areas are outside the official flood zone. Inaccurate perception of flood risk for an area may lead to the development of urban areas in unprotected areas, or to under-designing levees for protecting people against extreme events.

Figure 2.1.
A map for NYC, for the actual flooding due to Hurricane Sandy in 2012 (red color) and the 1/100 flood zone map (blue colors) provided by the Government before the event (Source: NYC, 2013).
Generally speaking, there are two approaches to arriving at distributions of natural disaster risks: statistical risk assessments and catastrophe models. The first approach looks only at the past and estimates risk from historical loss data using extreme value theory. A fundamental challenge is how to model the rare phenomena that lie outside of the range of available observation. While much real world data approximately follows a normal distribution, which implies that the estimation of distributional parameters can be done based on such assumptions, for natural hazard extremes, the tails (rare outcomes) are much fatter than normal distributions predict. This is accounted for in extreme value theory, according to which, natural disaster risk distributions are estimated using, for example, Gumbel, Weibull, or Frechet distributions. Typical steps in such an assessment are provided in ENHANCE for all case studies for which sufficient hazard or loss data is available. In the second approach, catastrophe models are applied, which are computer-based models that estimate the loss potential of natural disasters. This is usually done by overlaying the properties or assets that are at risk (exposure module) with hazard and vulnerability information.
For a sound analysis of current and future natural hazard risks, it is important to understand the dynamics of the underlying causes of risk. For example, the projections of climate variability and change should ideally be based on an ensemble of (regional) climate models that capture a broad spectrum of underlying uncertainties. Moreover, information about exposed economic assets and their vulnerability to hazards is needed. Combining these three dimensions is a non-trivial task, especially for the assessment of extremes. In ENHANCE, a new approach was developed to avoid the underestimation of such low-probability/high-impact events.
A risk-based approach
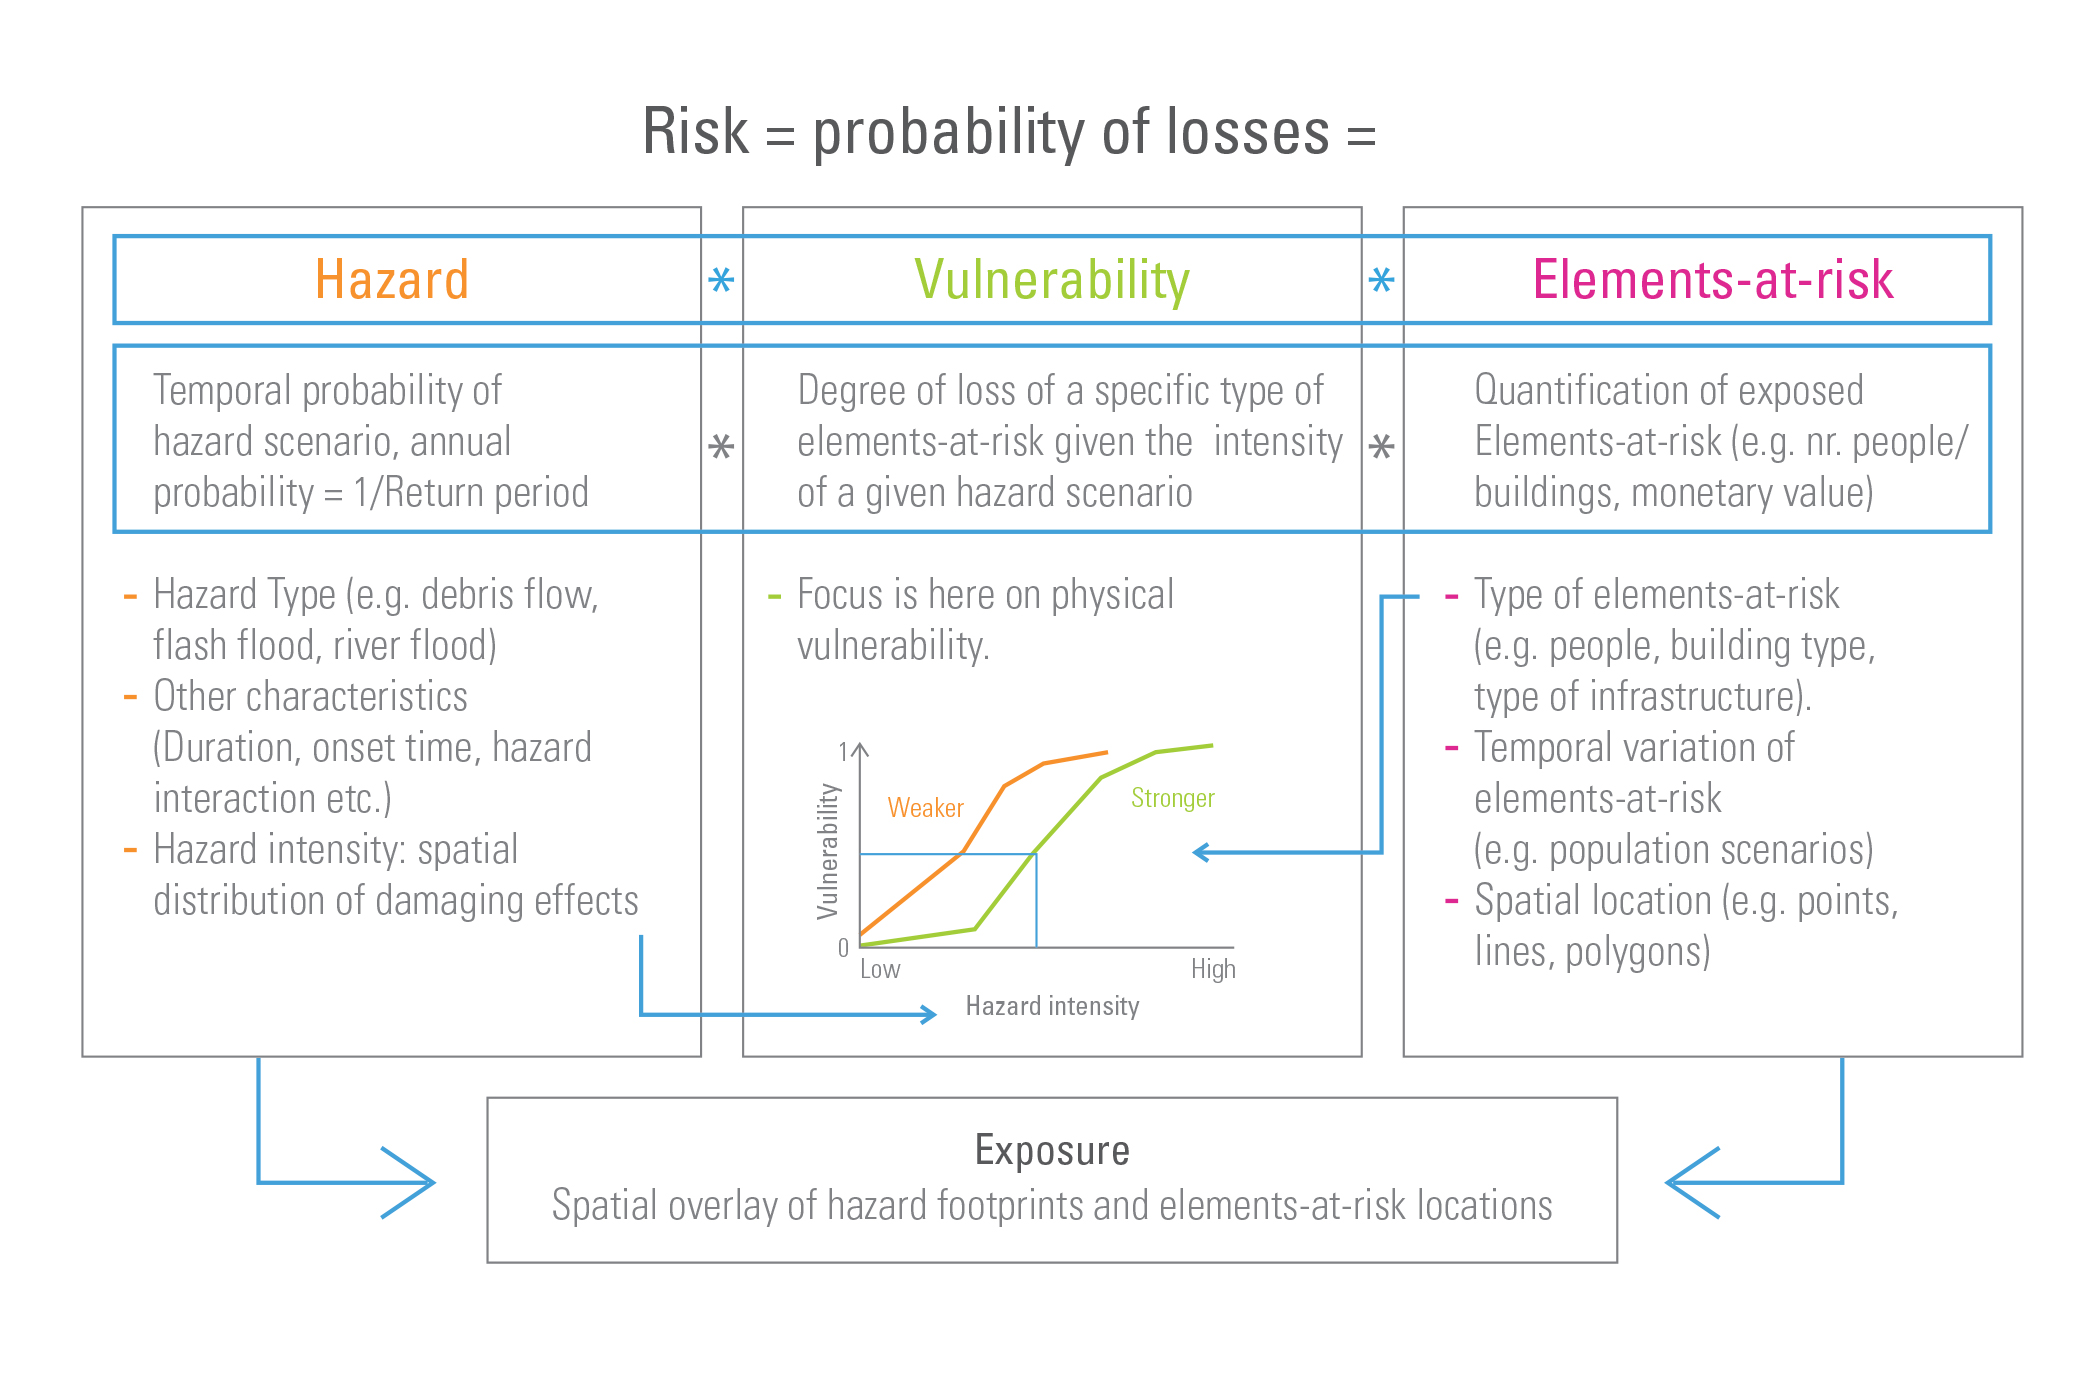
Within the ENHANCE project, we have followed a risk-based framework which has several components displayed in Figure 2.2: (1) Exposed assets (‘Elements at risk’): These are the assets at risk, such as people, buildings and infrastructure. (2) Hazard: the potential magnitude and frequency of hazards that threaten those assets, (3) Vulnerability: the level of protection and preparedness to reduce risk of the exposed assets. Losses can be calculated by combining the hazard information with exposure and vulnerability data.
Figure 2.2.
Schematic figure of risk as a function of hazard, vulnerability and elements-at-risk (Source: Van Westen, 2015).


